
Operational impact
Reduced unplanned downtime by a third
Vibration and temperature signals flagged bearing wear an average of 11 days before failure, giving maintenance crews a scheduled window instead of an emergency one.
Resources partner + CIDS applied analytics
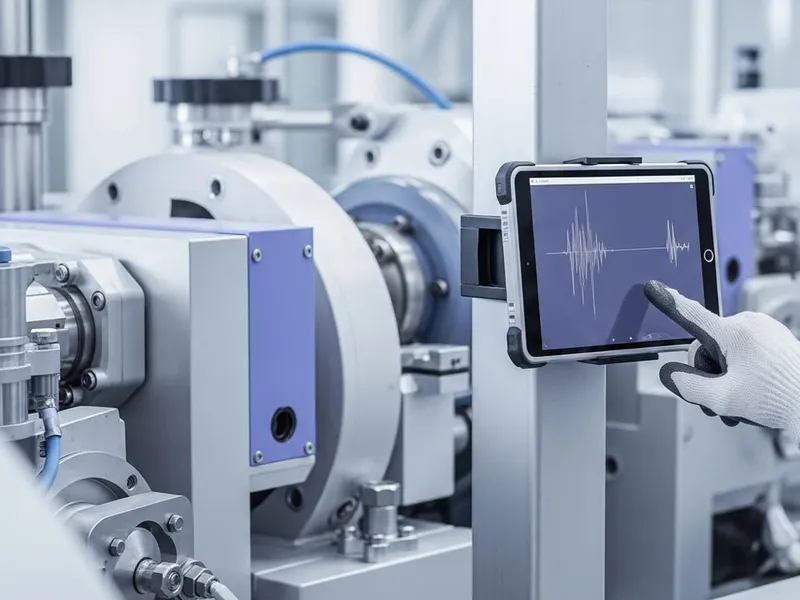
A sensor analytics pilot translating vibration and temperature readings from heavy plant equipment into early failure warnings, moving maintenance from a fixed schedule to an evidence-based one.
We used to replace parts on a calendar. Now we replace them when the data says to.
Maintenance lead
Resources partner
Operational impact
Vibration and temperature signals flagged bearing wear an average of 11 days before failure, giving maintenance crews a scheduled window instead of an emergency one.

Rollout
After a six-month trial at one site, the partner asked CIDS to extend sensor coverage to a second facility using the same model architecture.
Project overview
Heavy plant equipment at the partner’s site was serviced on a fixed calendar, regardless of actual wear. That meant some parts were replaced early, wasting spend, while others failed between scheduled visits, causing unplanned downtime.
CIDS fitted a subset of machines with vibration and temperature sensors, then built a model to flag developing faults against a baseline of normal operating signatures. Alerts routed straight to the maintenance team’s existing ticketing system, so no new tooling was required on their side.
The pilot ran for six months against one production line before the partner asked to extend it. Model thresholds are now tuned per-machine rather than using a single site-wide baseline, which cut false positives substantially in the second phase.

Before and after
2 operational shifts from the project
Before
Maintenance approach
Fixed calendar servicing regardless of actual wear.
Unplanned downtime
Failures discovered when equipment stopped.
After
Maintenance approach
Condition-based servicing triggered by sensor signals.
Unplanned downtime
Faults flagged an average of 11 days ahead.